
[Bitop Review] Cryptocurrency Pullback Isn't Over Yet! Where Will Bitcoin Fall To? Two Analysts Reach Consensus on This Price
2026年02月02日发布
As Bitcoin continues to tumble recently, the market is refocusing on where the true bottom range might actually lie. Recently, Benjamin Cowen, founder of the well-known analysis firm Into The Cryptoverse, and on-chain data researcher Checkmate, each used different charts and models but coincidentally turned their attention to the key range of $60,000 to $70,000.
When Bitcoin's Profit and Loss Supply Percentages Converge, It's a Buy Signal
Benjamin Cowen reposted a chart of "Bitcoin Percentage of Supply in Profit and Loss" and left a short but profound message: "Note to self: Buy Bitcoin when these two lines converge. "
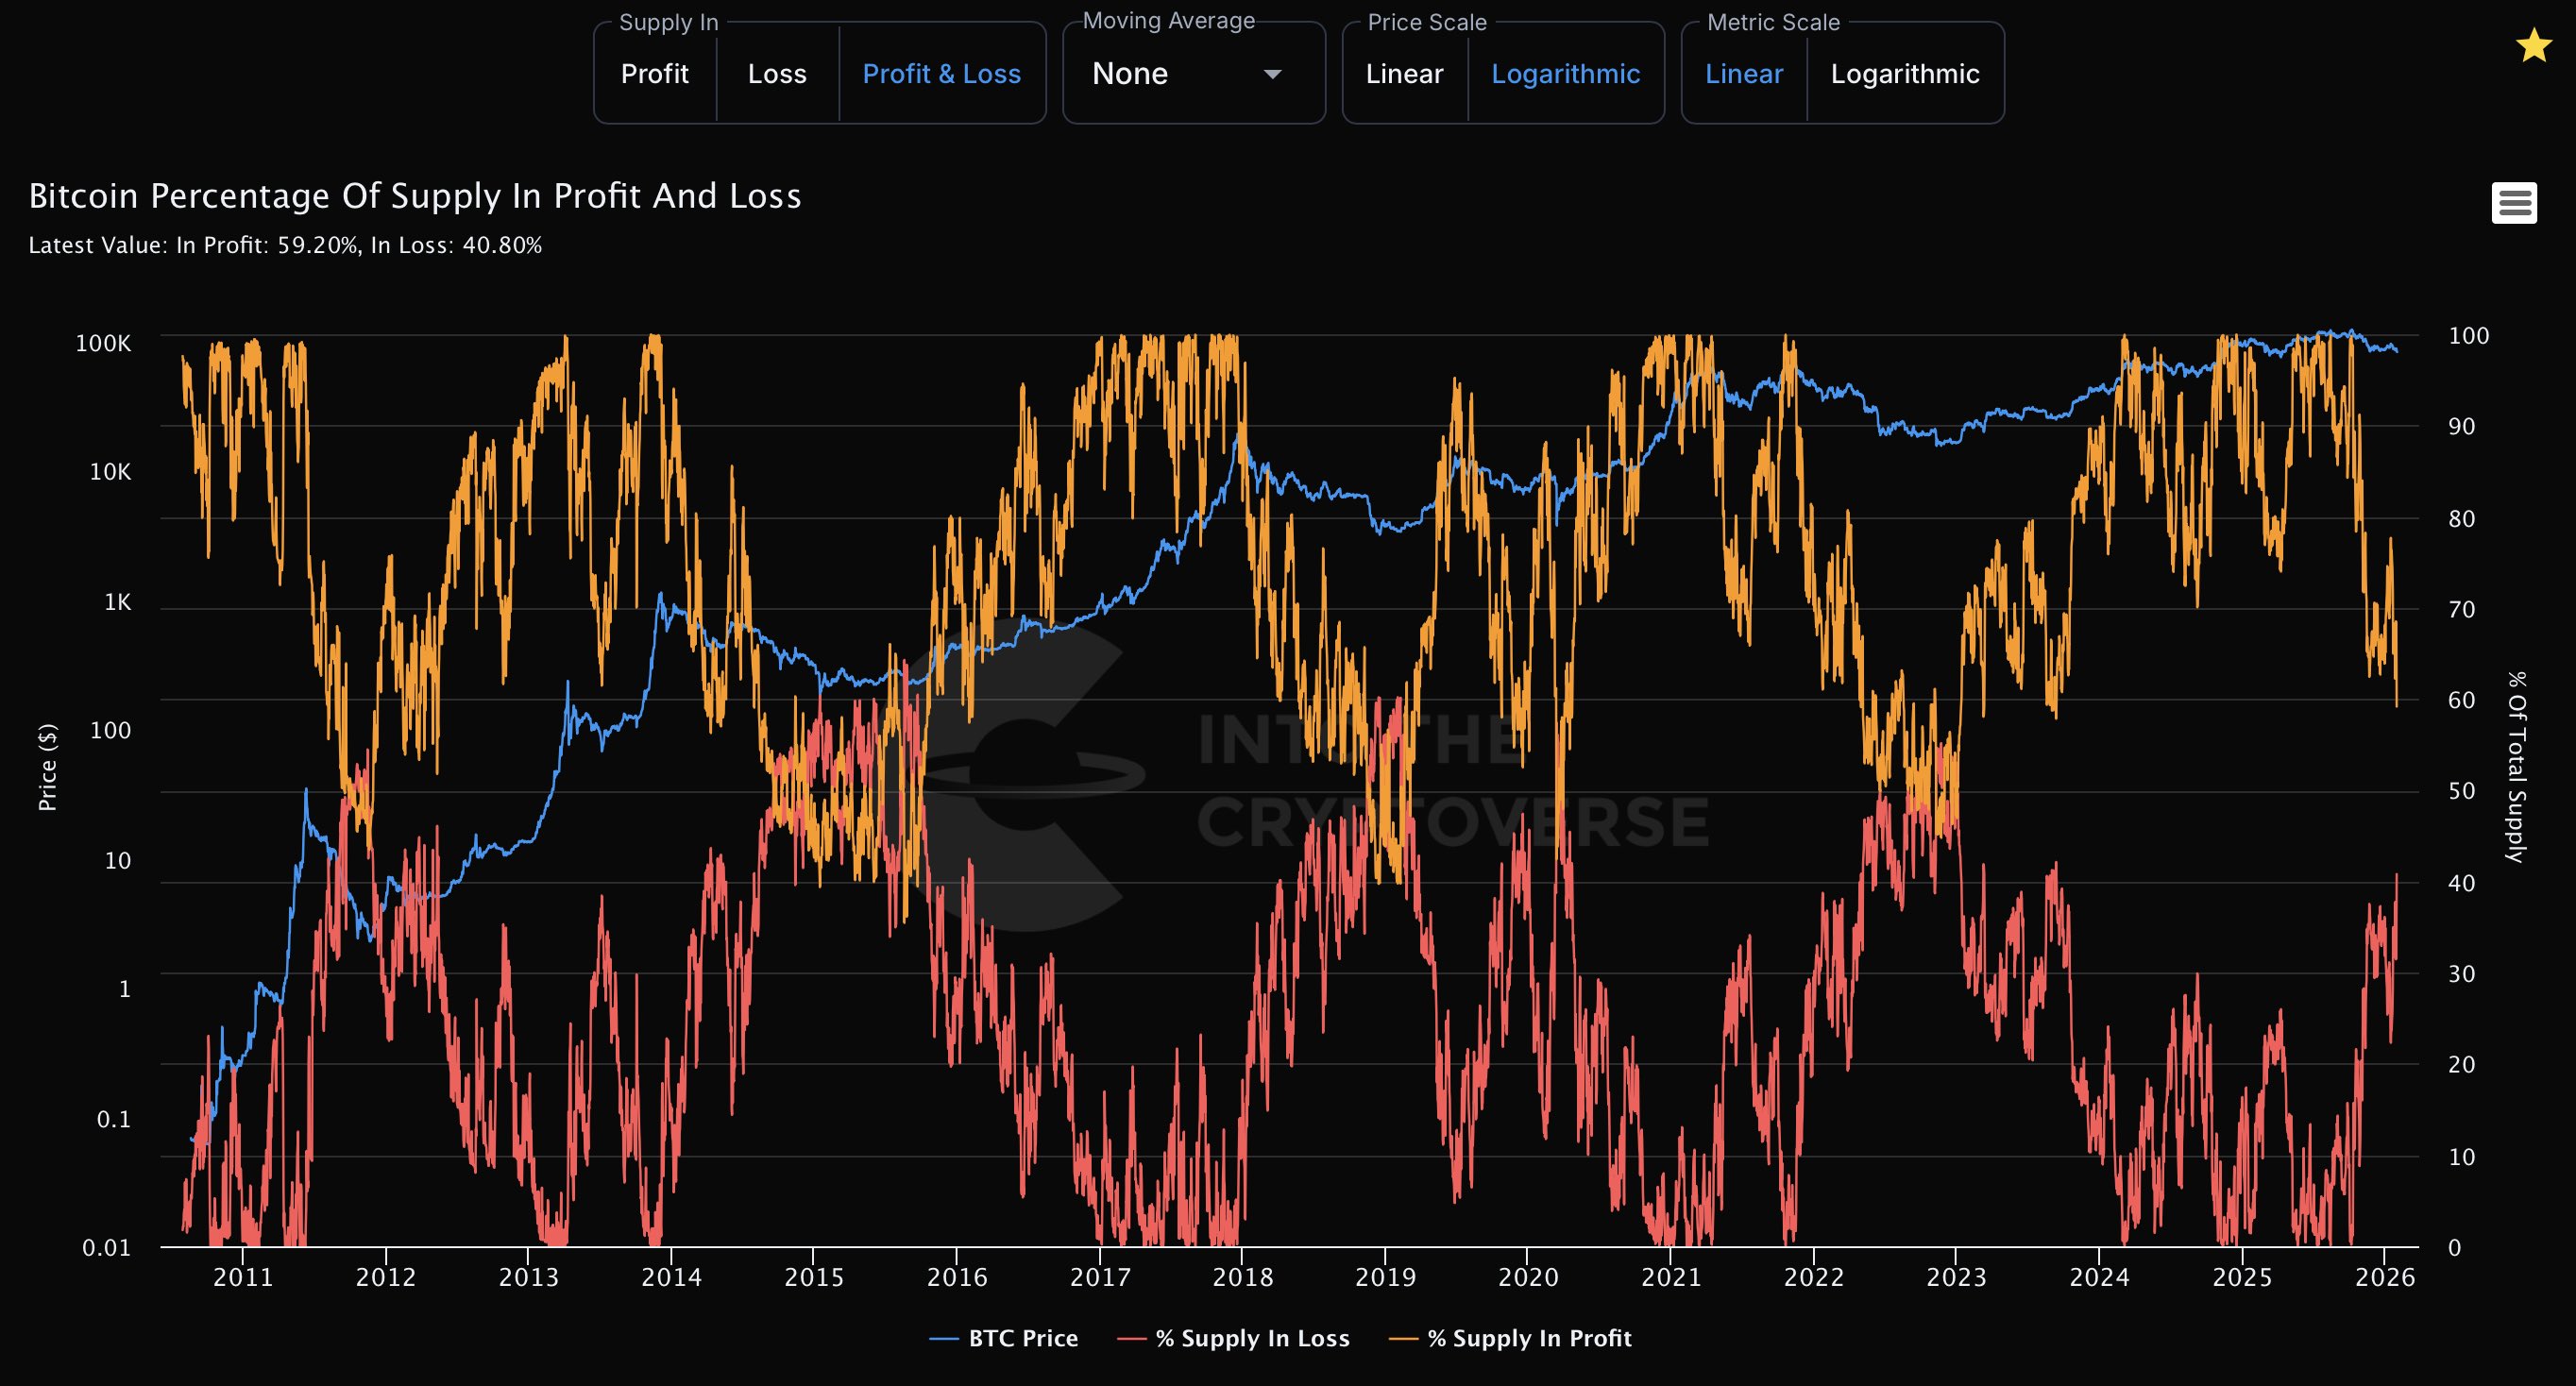
The core of this chart lies in the relative positional changes of the two lines:
Orange line: Percentage of Bitcoin supply in profit
Red line: Percentage of Bitcoin supply in loss
From historical experience, when the profit supply percentage drops rapidly and the loss supply percentage rises sharply, gradually converging, it often signals that the market has entered an extreme pessimistic phase. Such scenarios occurred at the end of 2015, 2019, and 2022, ultimately corresponding to highly attractive long-term buying opportunities. Cowen's reminder is essentially about waiting for the market to complete its painful capitulation.
From URPD Perspective: Target Price Should Be Around $65,000
In response, Checkmate posted a "URPD (UTXO Realized Price Distribution)" chart and stated directly: "$65k currently. However, that will shift as top buyers capitulate and lower the cost basis of the buyer, which makes $70k very interesting."
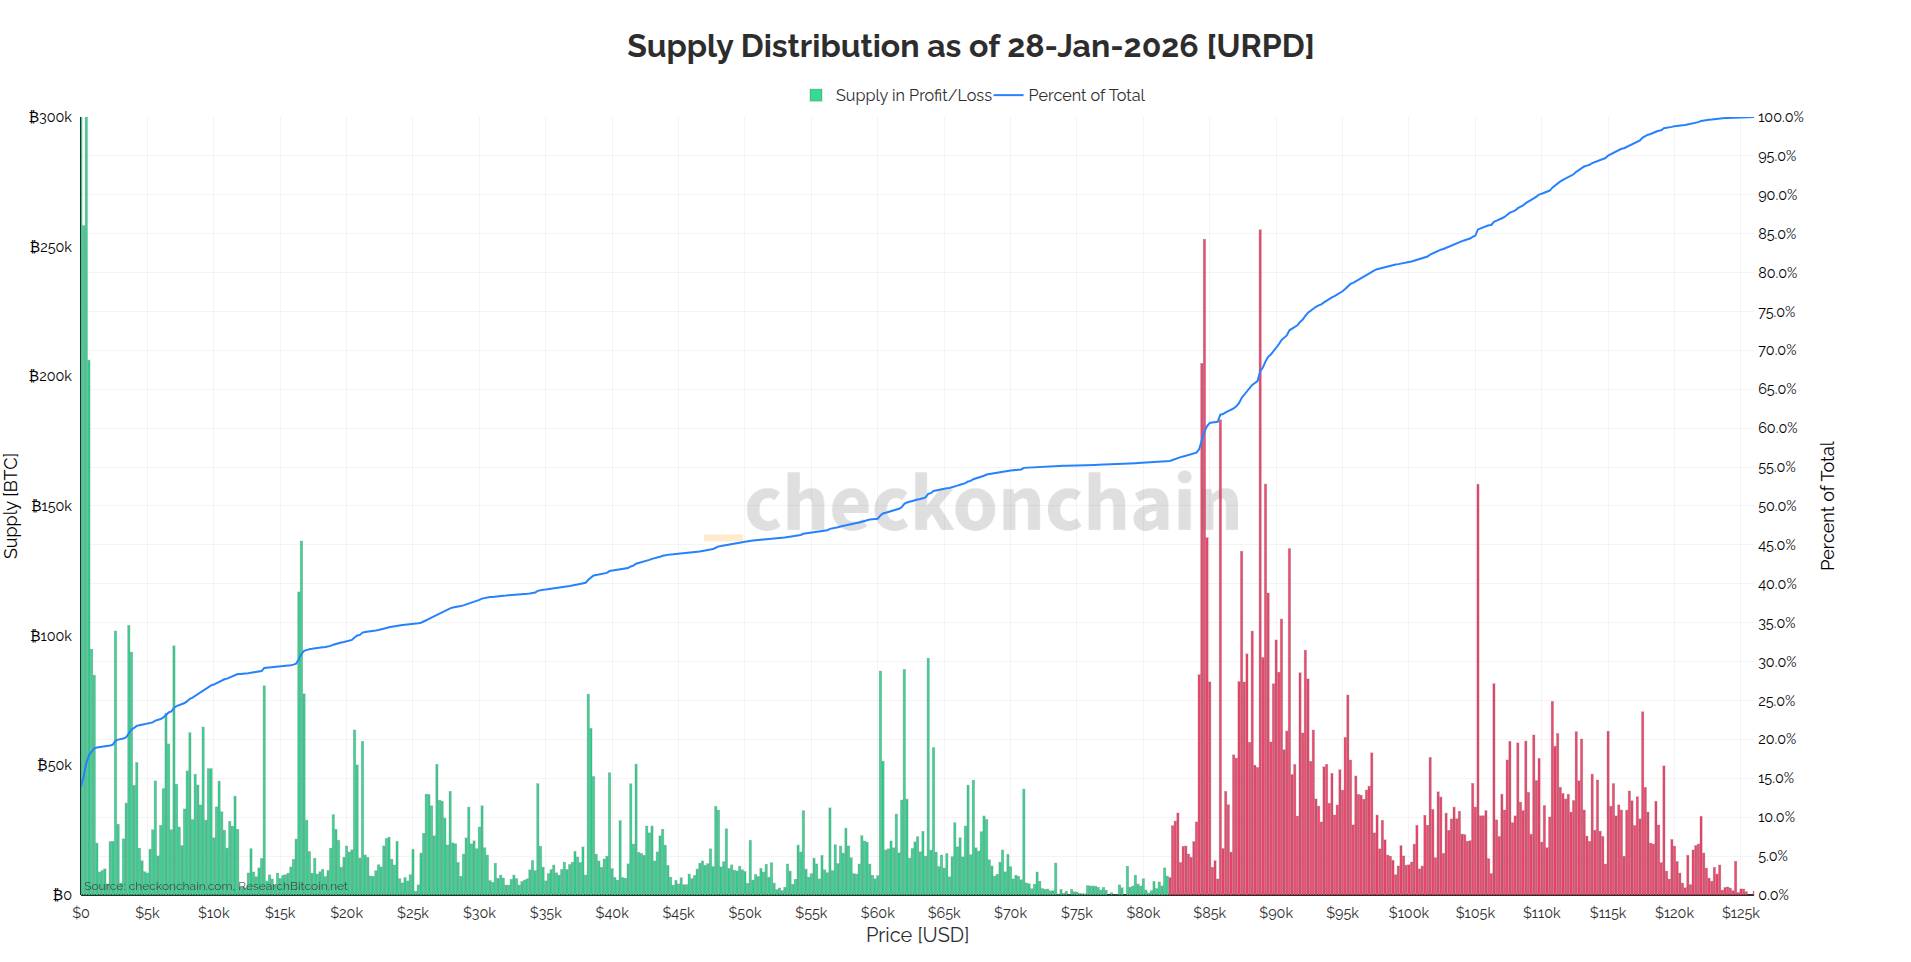
URPD focuses on revealing the overall distribution of holding costs in the market:
Green bars: Chips still in profit
Red bars: Chips in loss and underwater
From the chart, as prices pull back, a large number of chips bought at high levels are turning into losses. Checkmate pointed out that the theoretical profit/loss boundary is around $65k, but this is a floating number. As high-level buyers choose to capitulate and sell, chips transfer to buyers with lower costs, shifting the overall cost basis downward, making $70k a highly attractive zone in terms of psychological and structural support.
Bitcoin Consensus Price Range: Between $60k–$70k
Even more intriguing, Benjamin Cowen later added a historical comparison perspective. He stated that if the market follows a structure similar to the 2019 rebound followed by a deep retest, Bitcoin could see a pullback of about 50% from its highs, which exactly corresponds to the $60k–$70k range.
In other words, Cowen is waiting for the profit and loss ratios to converge from a long-term cycle and supply structure angle, while Checkmate highlights the dynamic support significance of $65k–$70k from on-chain costs and chip turnover. The two analytical paths ultimately point to the same price band. This suggests that the market pullback may not be fully over yet. Only when the proportions of profit holders and loss holders regain balance and complete a full round of chip turnover can new trends emerge.
If Bitcoin does indeed retest the $60,000–$70,000 range as the two analysts predict, it would not only be a price correction but also a key process for the market to deleverage and de-speculate, paving the way for the next phase of the rally.
Disclaimer: None of the information contained here constitutes an offer (or solicitation of an offer) to buy or sell any currency, product or financial instrument, to make any investment, or to participate in any particular trading strategy.