[Bitop Review] Crypto Analysis: BTC, ETH
2025年07月03日发布
BTC

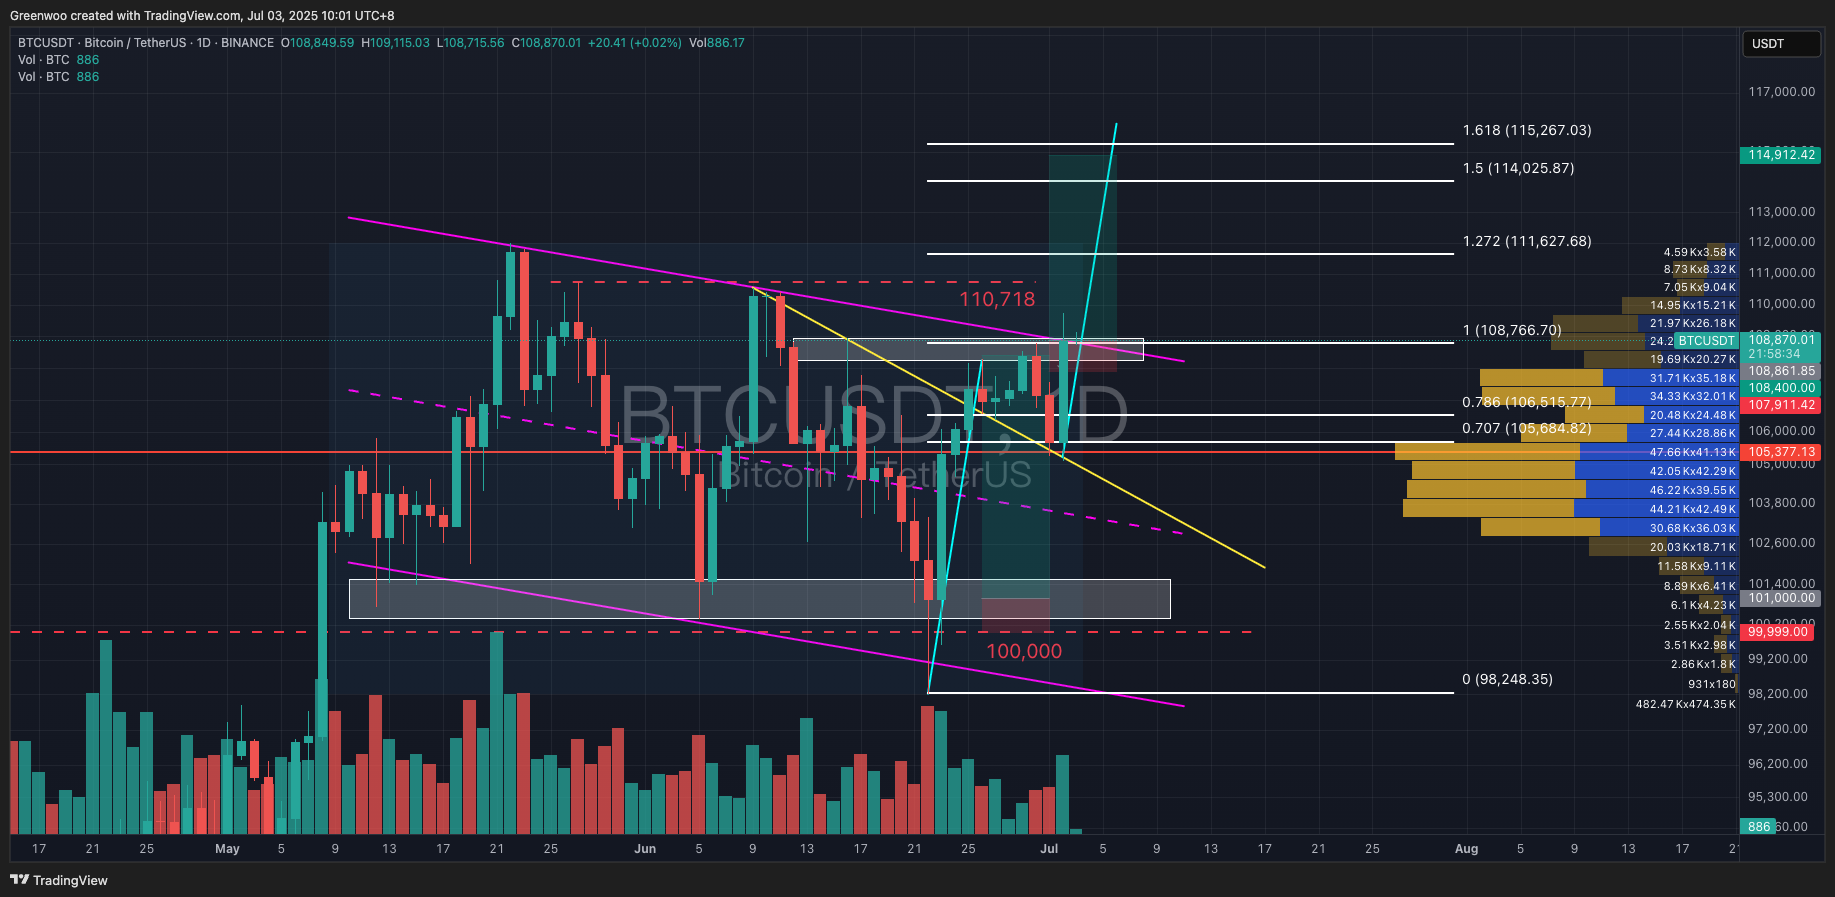
BTC's price recently broke through a short-term trendline (yellow line) but faced resistance at a previous high, pulling back. It found support around $105,100 and rebounded. The rebound aligns with the trendline and a high-volume trading zone, indicating strong support and a bullish outlook.
The price slightly broke out of a flag pattern (purple parallel channel) but pulled back again after facing resistance, currently trading around $108,850. This movement follows the classic 1-2-3 pattern, presenting a buying opportunity for investors. The take-profit target can reach up to $115,000. Stop-loss levels depend on individual risk tolerance, with a minimum at $105,000, below the recent rebound point.
Reference Levels:
Direction: Long
Entry: $108,800 - $109,000
Take Profit: $111,500 / $114,000 / $115,000
Stop Loss: $107,999 / $105,000
ETH

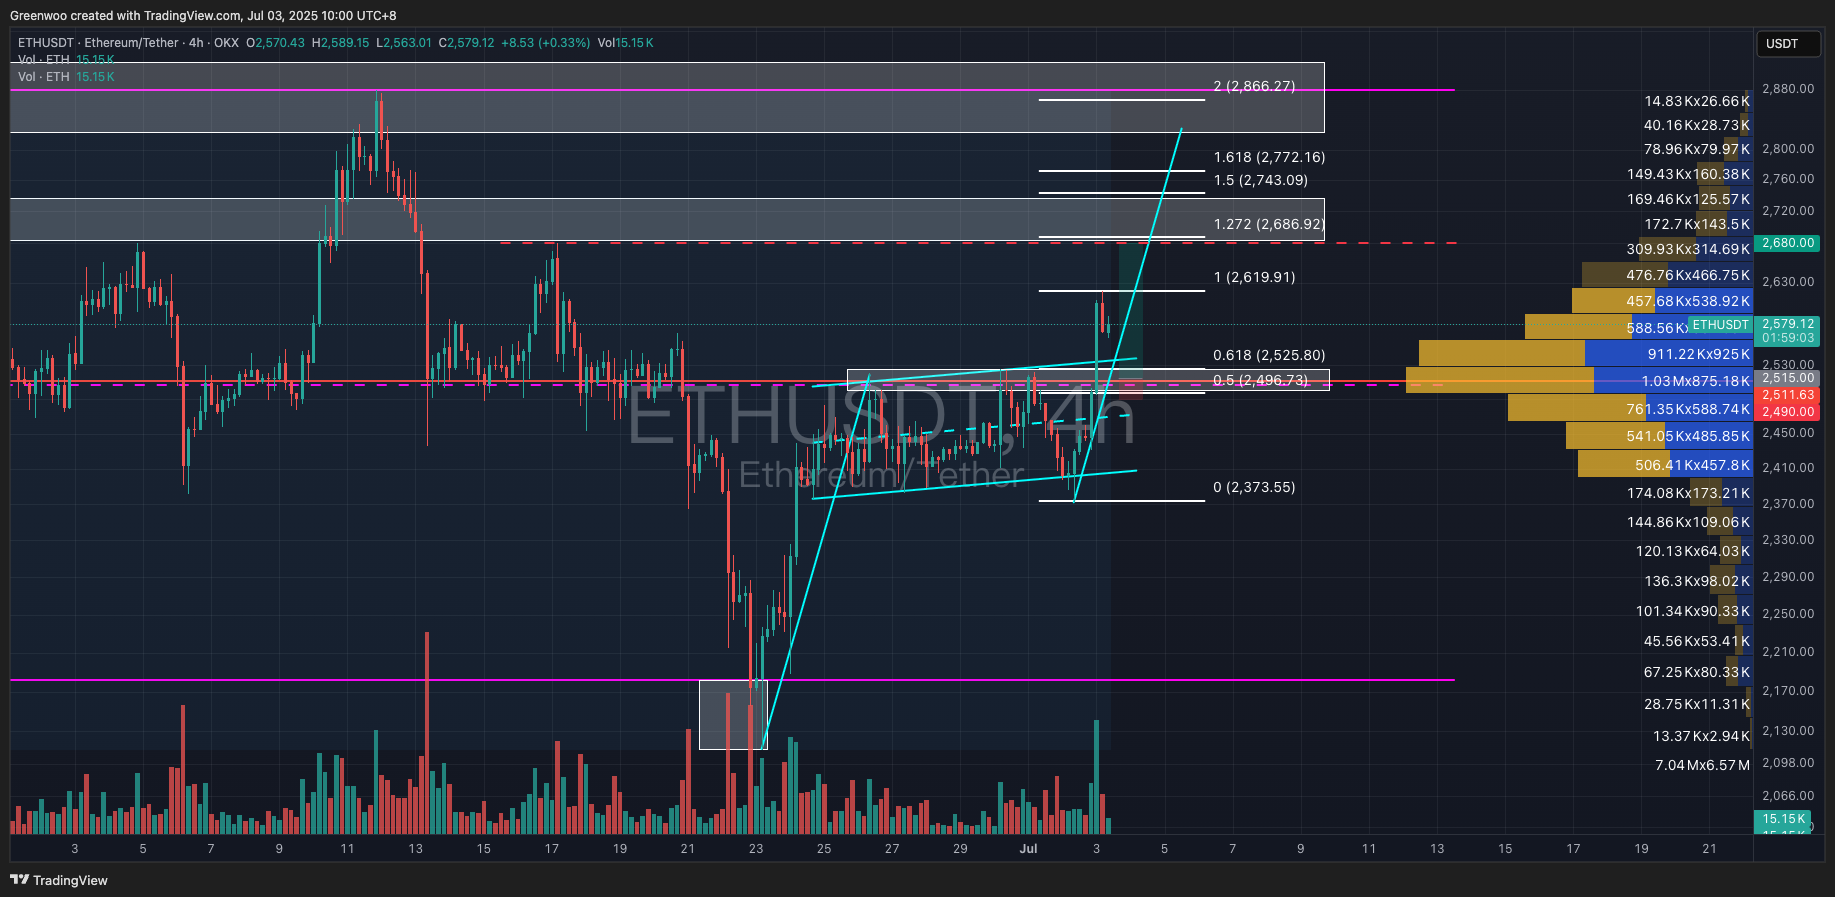
On the 4-hour chart, ETH's price has broken through the midpoint of a large trading range (purple dashed line) and a short-term flag pattern (light blue parallel channel). Yesterday, the price faced resistance around $2,620 and may retest the support zone below.
Investors can consider entering long positions at the support zone between $2,515 and $2,550, corresponding to the Fibonacci 0.618 to 0.707 levels, which also aligns with a high-volume trading area. Take-profit levels can be set at $2,680, $2,740, $2,770, and $2,820. Stop-loss levels, based on individual risk tolerance, can be placed below the support zone at $2,490 or the flag pattern’s midpoint at $2,449.
Reference Levels:
Direction: Long
Entry: $2,515 - $2,550
Take Profit: $2,680 / $2,740 / $2,770 / $2,820
Stop Loss: $2,490 / $2,449
Disclaimer: None of the information contained here constitutes an offer (or solicitation of an offer) to buy or sell any currency, product or financial instrument, to make any investment, or to participate in any particular trading strategy.